Health Equity & Socioeconomic Gradient Analysis
SEIFA-linked modelling of health outcome disparities across metro and regional South Australia to inform equity-focused program design.
A program-design stakeholder engaged Doppeldata to find, with evidence rather than assumption, where health-outcome disparities were most tightly bound to socioeconomic disadvantage - so an equity-focused program could be targeted where it would matter most. The instinct in this kind of work is to spread resources evenly, or to send them where the raw numbers look worst; both feel fair and both can miss the point. The question that actually determines where an equity program should land is narrower and harder: not simply where outcomes are poor, but where they are poor because of disadvantage - where the link between socioeconomic position and health is strongest, and therefore where an intervention aimed at that link has the most leverage.
- Identified the regions where the socioeconomic gradient in outcomes was steepest
- Gave the stakeholder a defensible, data-driven basis for where to target first
- Delivered a framework designed to be re-run as new outcome data arrived
The Challenge
The stakeholder needed evidence of where health-outcome disparities were most strongly tied to socioeconomic disadvantage across South Australia, to target an equity-focused program where it would have the most impact - rather than spreading resources evenly across metro and regional areas. The difficulty is that disadvantage and poor outcomes travel together for many reasons, and not all of them mean the same thing for policy. A region can show worse health simply because it has an older population, or a smaller and noisier one where a few cases swing a rate; a region can look disadvantaged on one index and unremarkable on another. Distinguishing a genuine socioeconomic gradient - a systematic relationship between disadvantage and outcome - from these confounds is what separates a targeting decision that holds up from one that merely follows the loudest number on a map.
Key objectives:
- Quantify the socioeconomic gradient in health outcomes across regions, not just the raw level of poor outcomes
- Separate genuine disadvantage-driven disparity from confounders like age structure and small-population noise
- Produce a prioritisation framework the program could act on - and re-run as data evolved
The Approach
The analysis linked outcomes to disadvantage and turned the result into a targeting tool, moving from raw data to a ranking the program could defend:
Data linkage
Health-outcome data was linked to SEIFA (Socio-Economic Indexes for Areas) scores across metro and regional areas, joining what happened to people with the socioeconomic conditions of where they lived. Because SEIFA offers several indexes capturing different facets of advantage and disadvantage, the linkage was built to let the relationship be tested against more than one, rather than resting on a single composite score.
Gradient modelling
The strength of the socioeconomic gradient in outcomes was modelled - how steeply outcomes worsened as disadvantage increased - while adjusting for the confounders that muddy a naive comparison, chiefly differences in age structure and the instability of rates in small populations. This is the step that separates a genuine disadvantage-driven disparity from a difference that only looks like one, and it is what let the findings survive the obvious challenges to them.
Prioritisation framework
Gradient strength was compared across outcome measures and assembled into a framework that ranked regions by combined disadvantage and outcome severity - not by either alone. The result was a defensible ordering the program could act on directly, and one deliberately built to be re-run as new outcome data arrived rather than being a one-off verdict.
The Results
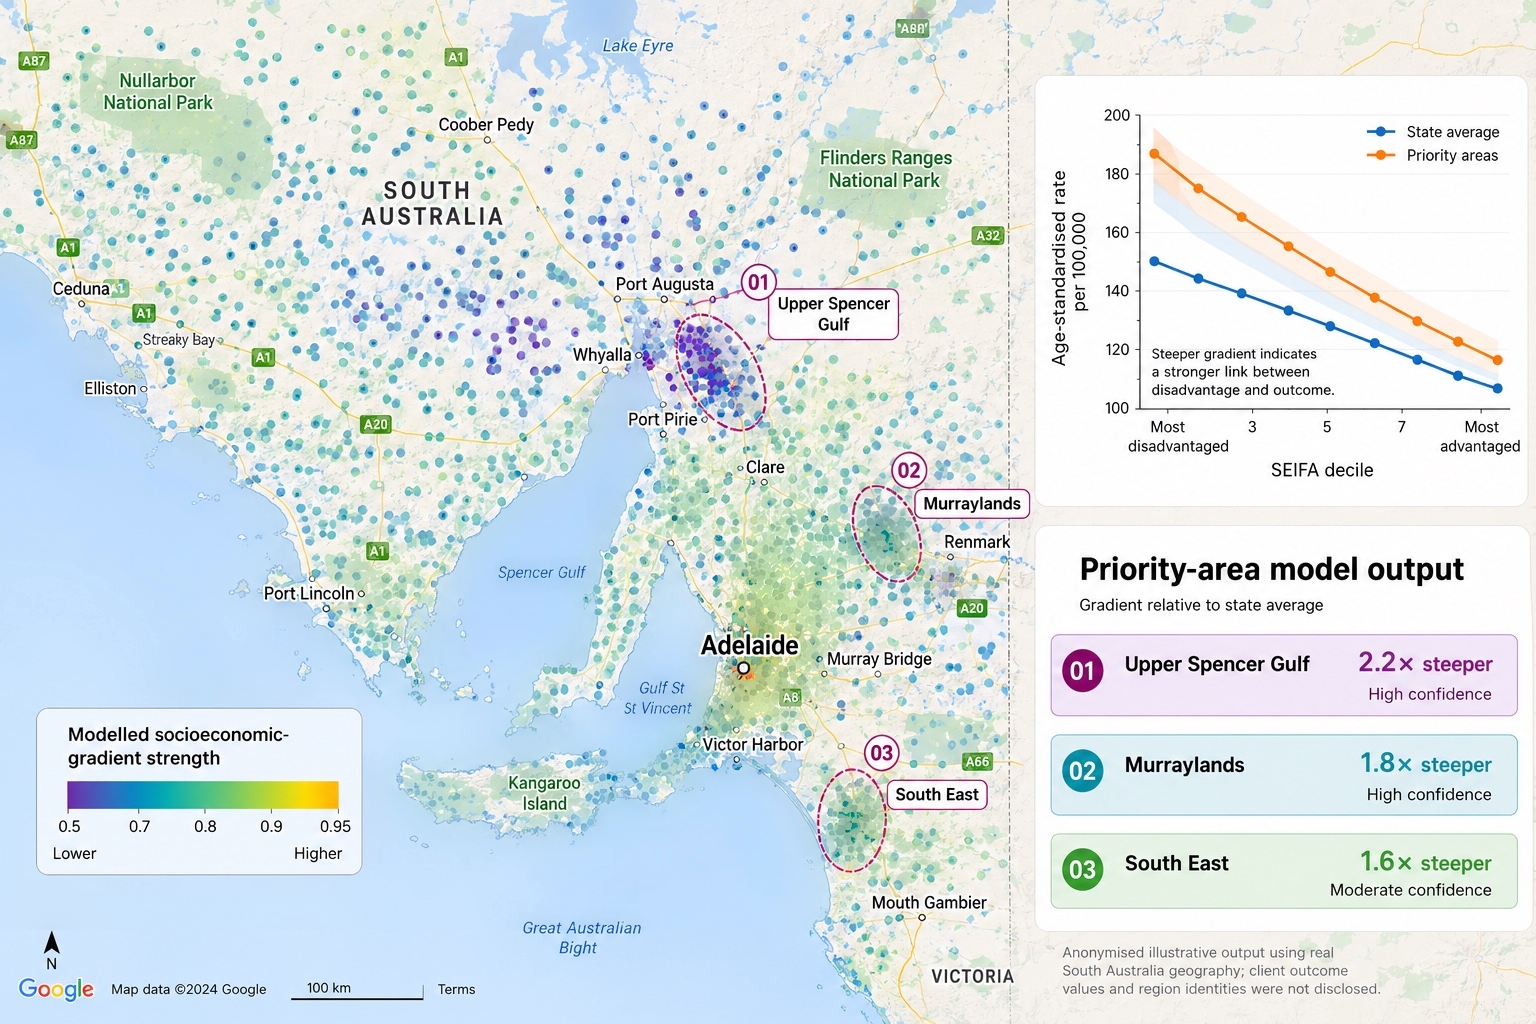
- Identified a small number of regions where the socioeconomic gradient was substantially steeper than the state average - the places where disadvantage was most tightly coupled to poor outcomes, and where a targeted program had the most to gain
- Gave the stakeholder a defensible, data-driven basis for where to target the equity program first, robust to the age-structure and small-population objections that would otherwise undermine it
- Delivered the ranking as a framework structured to be re-run as new outcome data became available, so the targeting could evolve rather than ossify
Why It Mattered
Equity-focused programs succeed or fail on whether resources actually reach the areas with the greatest need - and “greatest need” is easy to define lazily as “worst raw numbers,” which quietly sends effort toward regions that are simply older or larger rather than more disadvantaged. Quantifying the socioeconomic gradient properly, and adjusting for the confounders that distort it, meant the program could be targeted with real evidence behind it. Just as importantly, building the analysis to be repeatable meant the targeting wouldn’t be frozen to one snapshot: as outcomes shift, the ranking can be refreshed, so the program keeps aiming at where the need genuinely is.

Bioinformatics, statistical genomics & computational biology - practical tools, learning resources, and expert guidance based in South Australia. We are a community that believes in accessible knowledge and learning together.