Microbiome Diversity & Composition Analysis
16S microbiome analysis covering alpha/beta diversity, taxonomic composition, and differential abundance across sample groups for a microbiome study.
A microbiome study engaged Doppeldata to move beyond descriptive bar charts and establish, with proper compositional statistics, whether the community differences between their sample groups were real.
- Confirmed which group differences in community composition were statistically supported
- Identified the specific taxa driving those differences
- Gave the study a defensible basis for its microbiome conclusions
Past the stacked bar chart
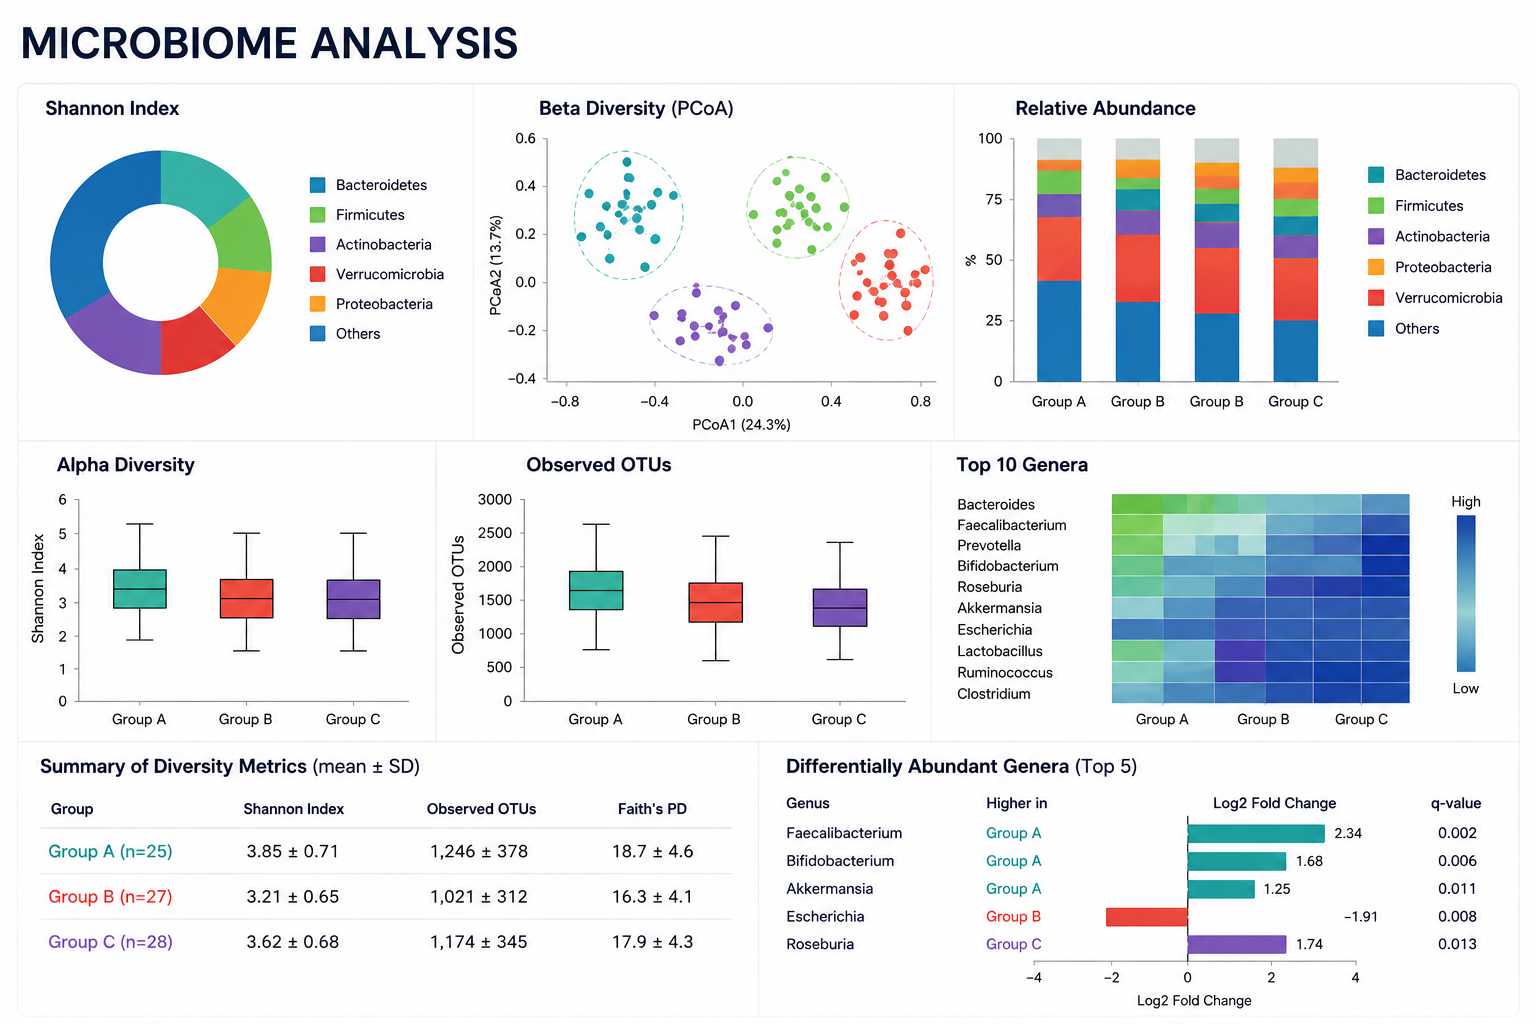
The study arrived with 16S sequencing across several sample groups and a stacked bar chart of taxa that looked like it told a story - some groups appeared to have more of this genus, less of that one. But a bar chart of average composition is a picture, not a test, and the study needed to know something the picture couldn’t tell them: were the differences between groups real, or just the kind of variation you’d see by chance between any two sets of samples? And if they were real, which taxa were actually responsible? Answering that credibly meant treating the data as what it is - compositional, noisy, and easy to misread - rather than as a set of proportions to eyeball.
Respecting how the data is actually shaped
The analysis was built around a fact that trips up a lot of microbiome work: this data is compositional. Sequencing gives relative abundances that are forced to sum to a constant, so if one taxon goes up, others must appear to go down whether or not anything happened to them - and standard tests that assume independent proportions will confidently report differences that are pure artefact. The reads were first resolved into an amplicon sequence variant table with taxonomic assignment, giving exact sequence-level features rather than fuzzy clustered ones. Diversity was then quantified on two fronts: alpha diversity for how varied each individual community was, and beta diversity for how different the communities were from one another, each paired with the appropriate statistical test for group differences rather than a visual impression from an ordination plot. Differential abundance - the “which taxa” question - was run with methods designed for compositional data specifically, so the taxa flagged as different were genuinely different and not just swept along by the constant-sum constraint.
What could and couldn’t be claimed
The payoff was clarity about which of the apparent group differences actually held up statistically and which were noise dressed up by the bar chart. For the differences that were real, the compositionally-aware testing named the specific taxa driving them - turning “these communities look different” into “these communities differ, and here is what’s responsible.” That gave the study a defensible footing for the microbiome claims it went on to make.
Why the method mattered more than the plot
Microbiome data punishes the intuitive approach: because it’s compositional, the ordinary statistical tests don’t just lose a little power, they give actively misleading results, and the errors look exactly like findings. Using methods built for that data structure was the difference between conclusions that would survive scrutiny and conclusions that merely looked convincing on a slide. The study ended up able to say what its data supported - and, just as valuably, to not claim what it didn’t.

Bioinformatics, statistical genomics & computational biology - practical tools, learning resources, and expert guidance based in South Australia. We are a community that believes in accessible knowledge and learning together.