RNA-seq Differential Expression Analysis
End-to-end RNA-seq differential expression pipeline with QC, normalisation, and pathway enrichment for a research group comparing treatment conditions.
A research group engaged Doppeldata to turn raw RNA-seq counts into a defensible, reproducible account of which genes and pathways were changing between their treatment conditions - replacing ad-hoc analyses that were giving inconsistent answers.
A research group had run their RNA-seq experiment and had the counts to show for it - but getting from a matrix of numbers to a list of genes they could actually defend was where things had stalled. Different team members were reaching different conclusions from the same data, each running their own spreadsheet analysis with their own thresholds, and none of it could be reproduced or trusted enough to design the next experiment around. What they needed wasn’t another analysis; it was one analysis, done rigorously, that would give the same answer every time.
- Replaced inconsistent ad-hoc analyses with one reproducible, version-controlled pipeline
- Delivered a ranked, statistically-corrected DE gene list plus enriched pathways per comparison
- Fed results straight into the group's follow-up experimental design
The trouble with a spreadsheet
Differential expression looks deceptively simple - subtract, divide, sort by fold change - which is exactly why it goes wrong so quietly. Counts have to be normalised for library size before any two samples are comparable, or the most deeply-sequenced sample masquerades as the most active. The mean-variance relationship in count data breaks the assumptions of the simple tests people reach for. And testing tens of thousands of genes at once, a raw p-value threshold of 0.05 will hand back thousands of “significant” genes by chance alone. The group’s spreadsheets were tripping over all three, which is why the same data kept yielding different gene lists depending on who opened the file.
Building it to be right, and repeatable
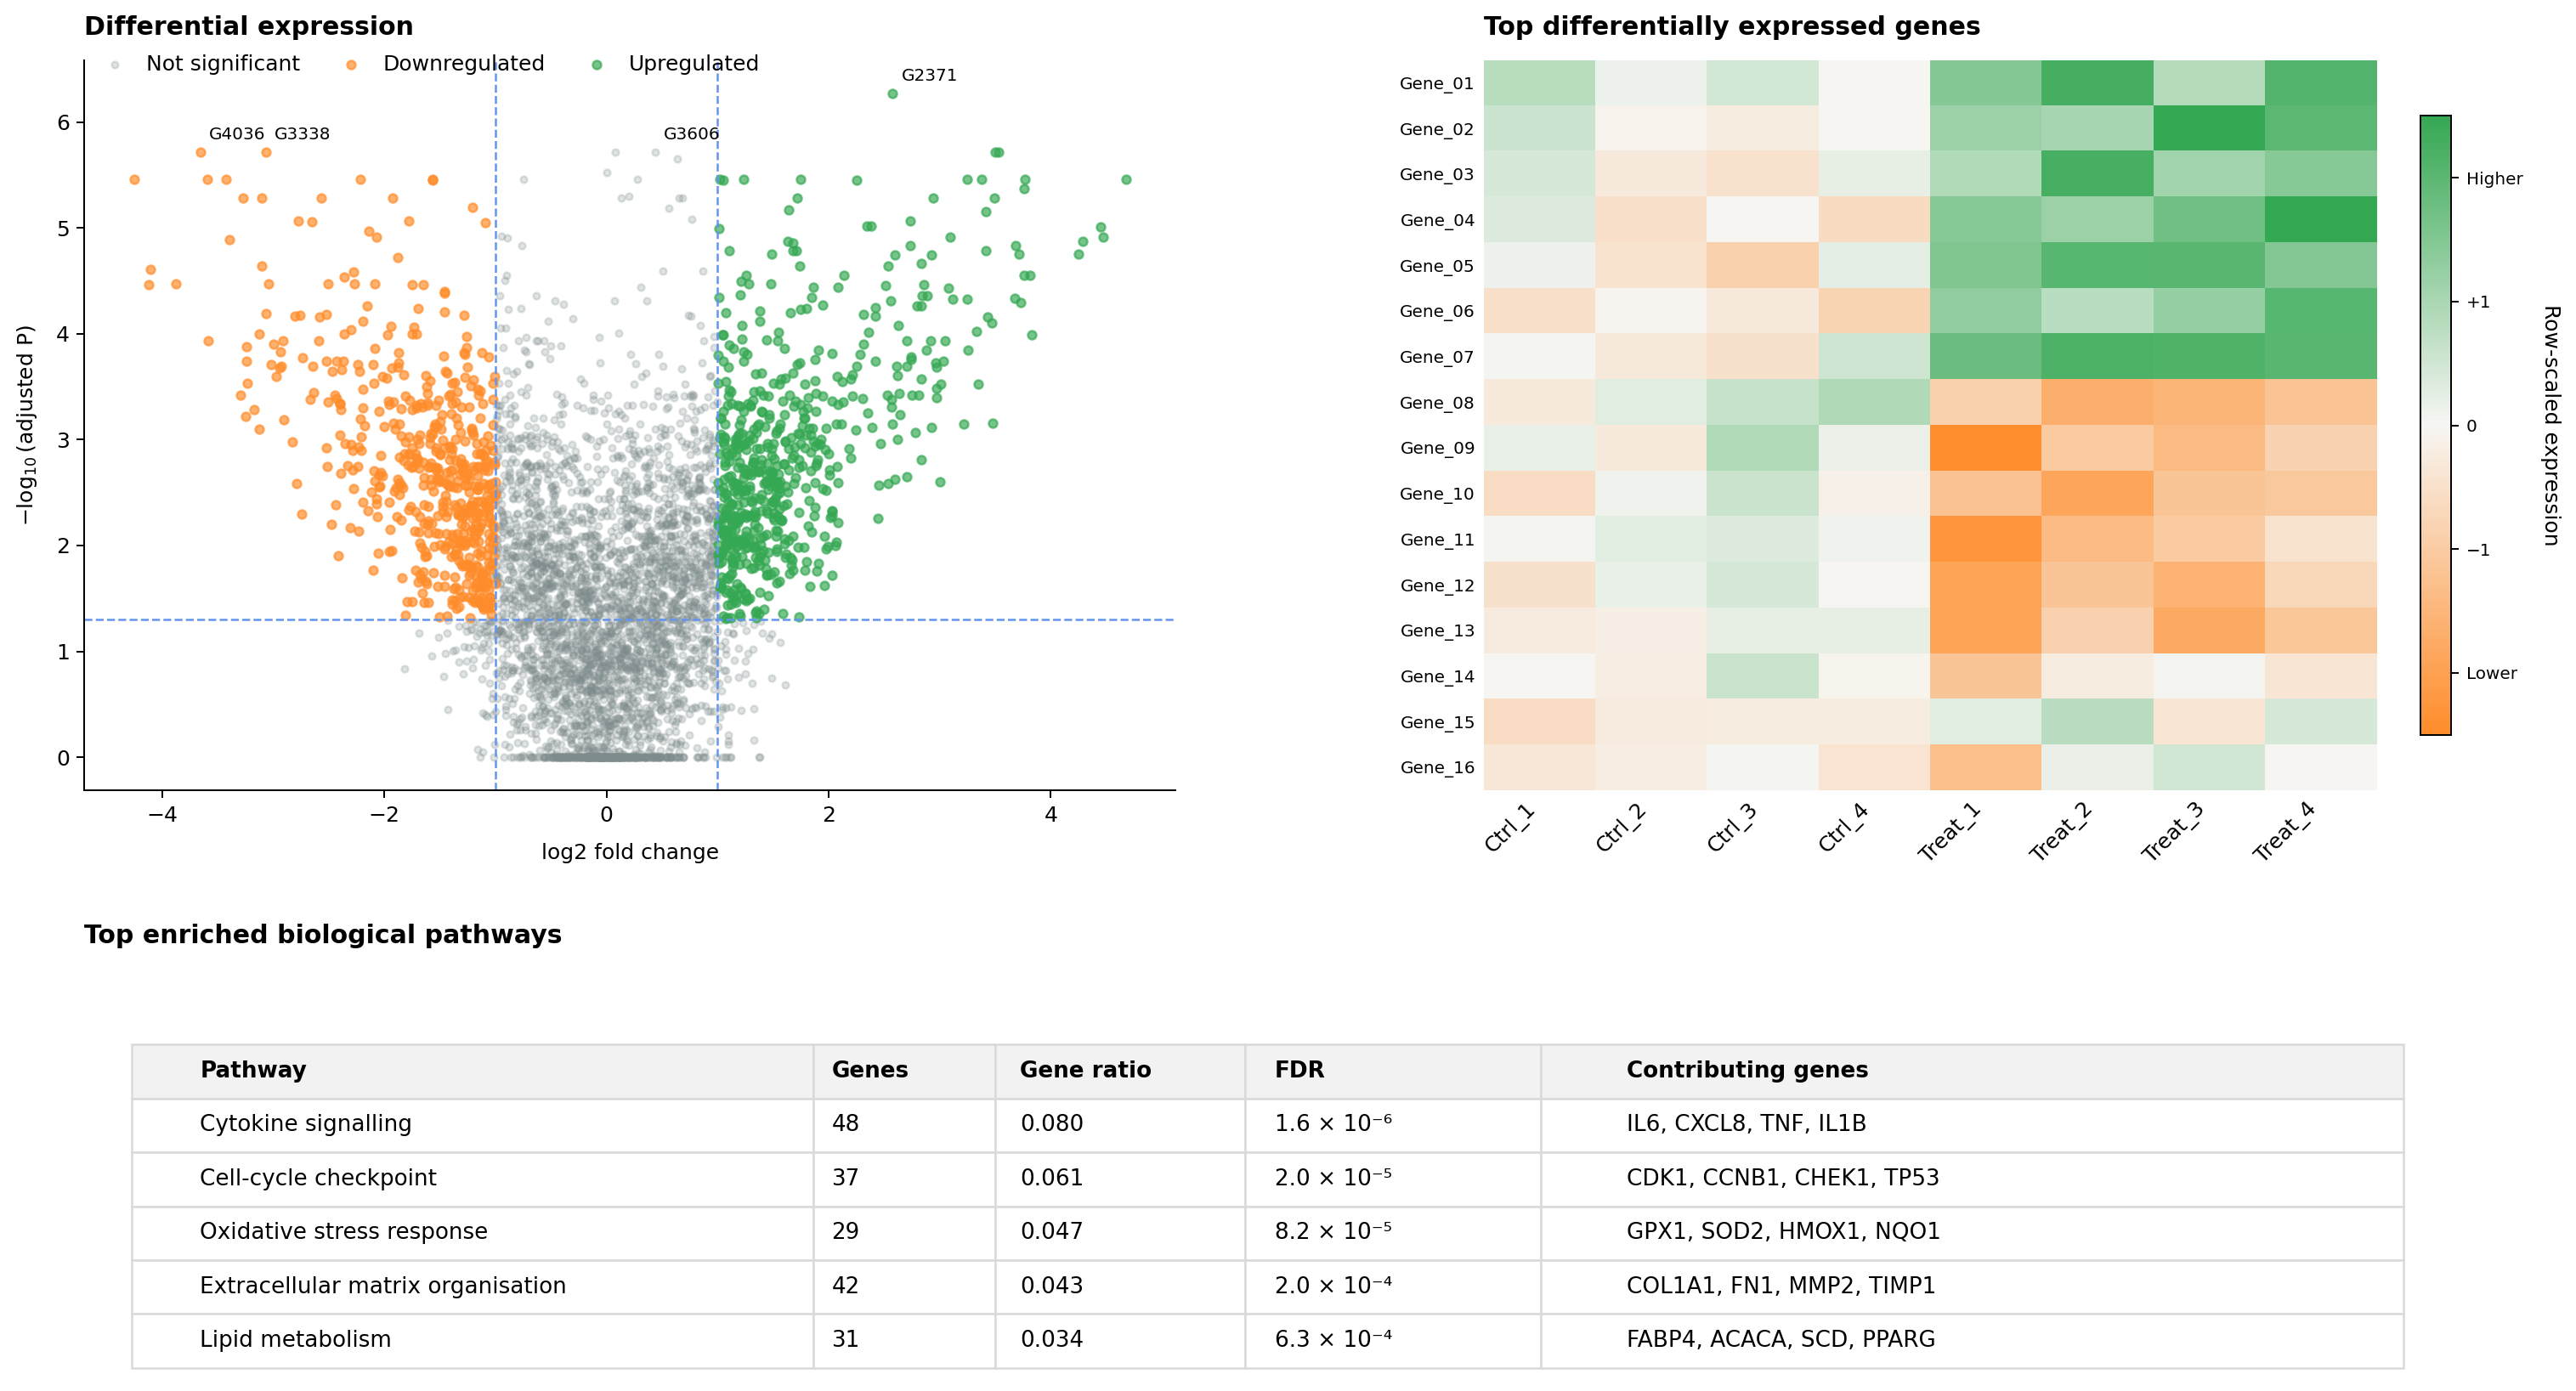
The work replaced the ad-hoc analyses with a single pipeline built on the established count-based frameworks rather than spreadsheet arithmetic. Low-count genes were filtered out first - genes with almost no reads carry no signal and only add to the multiple-testing burden. Counts were normalised for both sequencing depth and composition, so samples became genuinely comparable. Differential expression was then modelled with a method that respects the mean-variance structure of count data, and - the step the spreadsheets had skipped - p-values were corrected for multiple testing with a false-discovery-rate procedure, so the reported gene list reflected a controlled error rate rather than an inflated one. The whole thing was version-controlled and documented so any team member could re-run it and land on precisely the same result.
From a gene list to biology
A ranked, statistically-corrected list of differentially expressed genes was delivered for each treatment comparison - but a list of gene names isn’t yet an insight. Gene-set and pathway enrichment was layered on top, moving the output from which genes changed to which biological processes were affected, which is the form the group could actually reason about. Because the pipeline was reproducible, those enriched pathways fed directly and confidently into the design of their follow-up experiments.
Why it was worth doing properly
The failure mode here is invisible: a badly-run DE analysis doesn’t error out, it just returns a longer, wronger gene list, and the false positives only reveal themselves later when the follow-up experiments don’t replicate. Getting normalisation and multiple-testing correction right isn’t statistical fussiness - it’s the difference between building the next experiment on signal or on noise. A single reproducible pipeline meant the group could finally trust the gene lists they were staking their next round of work on.

Bioinformatics, statistical genomics & computational biology - practical tools, learning resources, and expert guidance based in South Australia. We are a community that believes in accessible knowledge and learning together.